How to Use Camera Histograms in Photography for Perfect ExposureCamera histograms are not just a pretty graph. Histograms have had a major impact on how we expose our photographs in the field.
This article is part of a series of articles. Please use the links below to navigate between the articles.
- Introduction to Photography Course - Definition & Types of Photography
- How Cameras Work and Terminology Explained for Beginners
- What is the Exposure Triangle and How Does It Affects Exposure?
- Understanding Camera Shutter Speed for Beginners
- Aperture and Depth of Field in Photography Explained
- What is Digital Photography ISO and Grain?
- How to Understand Camera Lenses and Focal Length
- Essential Photography Composition Rules To Improve Your Photos
- Camera Metering Modes Demystified - Which One To Use
- Camera Shooting and Exposure Modes Explained
- Complete Guide to Flash Photography for Beginners
- When and How To Use A Camera Tripod In Photography
- What Are White Balance And Colour Temperature Camera Settings?
- How to Use Camera Histograms in Photography for Perfect Exposure
- Master These 10 Camera Settings For Your Best Photographs
- Why You Should Be Shooting in RAW - Reasons and Benefits Explained
- Essential Photo Editing Techniques to Enhance Photographs
- Complete Guide to Macro Photography for Beginners
- Beginners Landscape Photography Guide for Stunning Photos
What are Camera Histograms in Photography?
A histogram in photography is a graphical representation of the tonal values of your photo. In other words, it shows the number of tones of particular brightness found in your photograph ranging from black (0% brightness) to white (100% brightness). Histograms have a vertical axis showing the number of pixels in each of the 256 brightness value channels, and the horizontal axis represents the brightness of the light. The latter ranges from pure black on the left to pure white on the right. This range of brightness is often split into the broader categories of shadows, midtones and highlights. How the camera's histogram looks relies entirely on the scene it's representing, so there is no one, ideal histogram shape to aim for.
When exposing landscapes, there are two rules you need to think about. The first is to expose for a midtone and the second is to avoid burnout or clipping.
A midtone is an area of the scene that falls halfway between the darkest and lightest parts of the shot. Once located, you can use the midtones as a reference point to ensure that the midtones in the scene translate to midtones in the captured image. It's a simple concept but ensures that the foreground details are visible for a natural-looking picture. Grass and other foliage make a reliable midtone, so long as it's under the same lighting conditions as the majority of the shot.
Burnout, or clipping, occurs when highlight tones become so bright they turn pure white - all underlying detail is irrevocably lost. A spot of burnout around the sun is perfectly OK, but huge stretches of a boring white sky are not. Ideally, you want all the major parts of the scene to contain plenty of colour and detail.
Avoiding burnout in the sky, while getting a good foreground exposure, is easier said than done. The reason is that the vast tonal range of the landscape is often too much for the camera to handle. Cameras can only capture a slice of what's on offer, so something has to give. If you expose for the midtones then there is a good chance the sky will burn out. If you expose the highlights, then the foreground will fall into silhouette. You need to think carefully about what's most important in your scene and expose it accordingly. Of course, if you don't want to compromise you can use a neutral density or graduated filter or use a HDR technique to expand the dynamic range.
Clipping and Burnout on Camera Histograms
To avoid clipping, ensure that your histogram barely contacts the left or right sides of the graph. That will ensure that you retain the details you need in those dark and light areas.
Some cameras feature a highlight warning which is often called "blinkies". This can give you a visual warning when playing back your shots when clipping occurs. The exact method varies by manufacturer, but in general, highlights will appear to blink between white and black or are highlighted in bright red. If you see these blinks then clipping has occurred and you need to address that.
Camera Histograms Explained and How to Read a Histogram
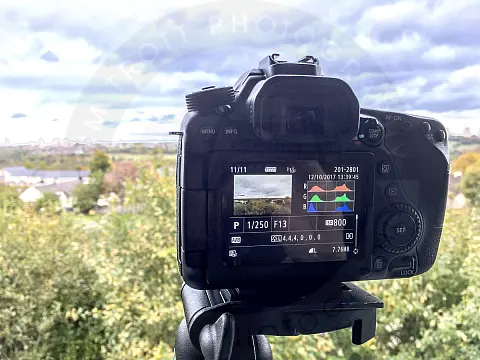
You can call up the histogram on your camera's LCD to judge the tonal distribution in a photo. The horizontal axis show pixel brightness, ranging from pure black on the left to pure white on the right. The vertical axis shows the number of pixels at a particular brightness level.


Not enough light has reached the sensor, either too fast a shutter speed or too narrow an aperture, or both. This shot's histogram is pushed to the left, a situation known as clipping. If printed, the clipped areas will appear completely black and all shadow detail will be lost.


This histogram should correspond with the tones of your scene. A dark scene should have a histogram with a bell shape on the left. A light scene should have a histogram with a bell shape on the right. For daylight scenes, expose the scene as far to the right as possible without clipping the highlights.


Too much light has reached the sensor. Notice how the histogram reveals that the tonal distribution is pushed to the right and that the highlights are clipped. If printed, the areas of the scene which should reveal detail will appear as pure white.
High Key, Low Key and Contrast
The "Perfect Histogram" Myth
There are claims on the internet that one or a histogram shape should be perfect and that it is the shape to aim for in all your photography, the perfect histogram.
I don't believe this to be the case. Many variables can affect the photo's histogram. The camera settings and the scene you're shooting directly affect your histogram before you even click the shutter. You can see from the examples above, different scenes and lighting create vastly differing histograms. Are they all incorrect? As long as there is no clipping and the midtones are sufficiently exposed then the perfect histogram is the one in which the photo looks good. Don't try and fit your scene, lighting and settings to make the perfect histogram shape. Let the scene speak to you, and if it requires more shadows, let the histogram reflect that; if it requires more highlights, that's fine too!


